%matplotlib inline
Observaciones:
- sebastiandres en twitter y github.
- Presentación en github.com/sebastiandres/charlas
- Opiniones y críticas a título personal.
Introducción
¿Porqué esta presentación?
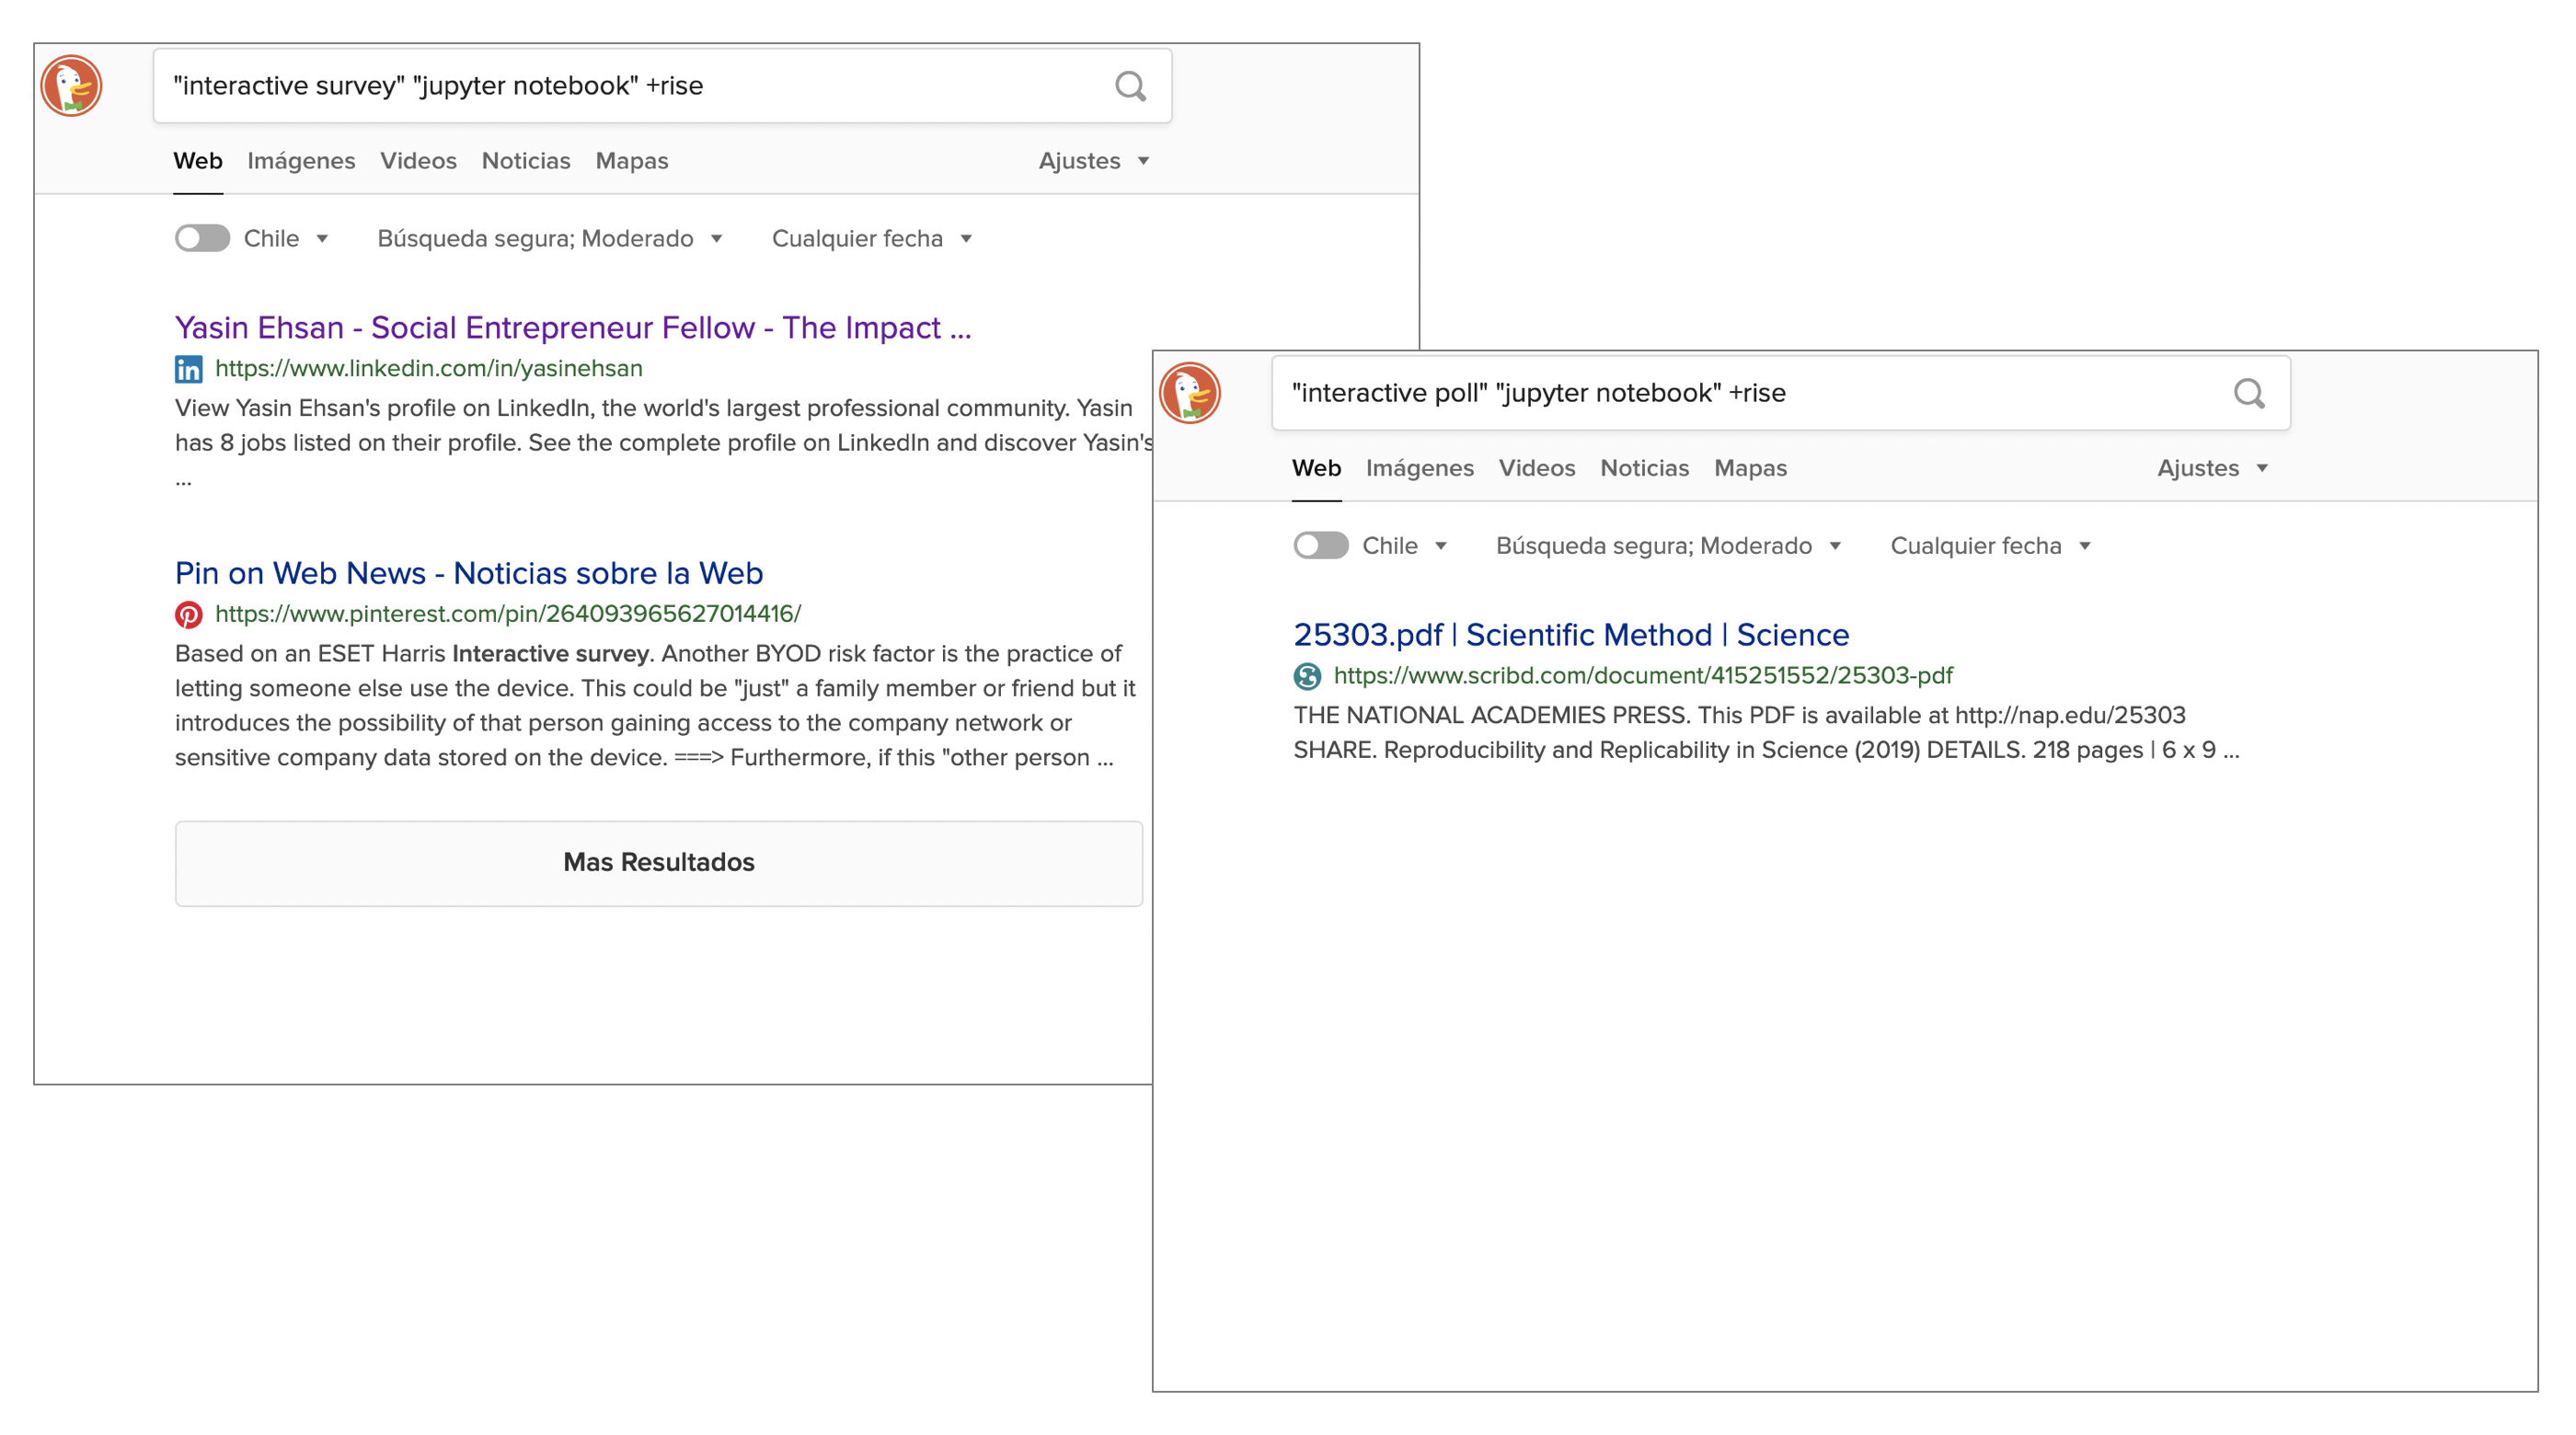 ¿Se pueden hacer encuestas interactivas en presentaciones con jupyter notebooks?
Agenda
- Sobre hacer presentaciones con RISE.
- Solución 1: Quick & dirty.
- Solución 2: ¡Pero quiero los datos!
- Solución 3: No confío en nadie.
0.1 Sobre hacer presentaciones con jupyter y RISE
¿Consejos sobre hacer presentaciones en general?
- Contenido pensado en tu audiencia.
- Ensayar, ensayar, ensayar.
- Incrementar el desafío.
0.2 Sobre hacer presentaciones con jupyter y RISE
Si forma parte importante de tu día a día, investiga y aprende a hacer mejores presentaciones.
Libro que considero muy bueno: Confessions of a public speaker - Scott Berkum.

0.3 Sobre hacer presentaciones con jupyter y RISE
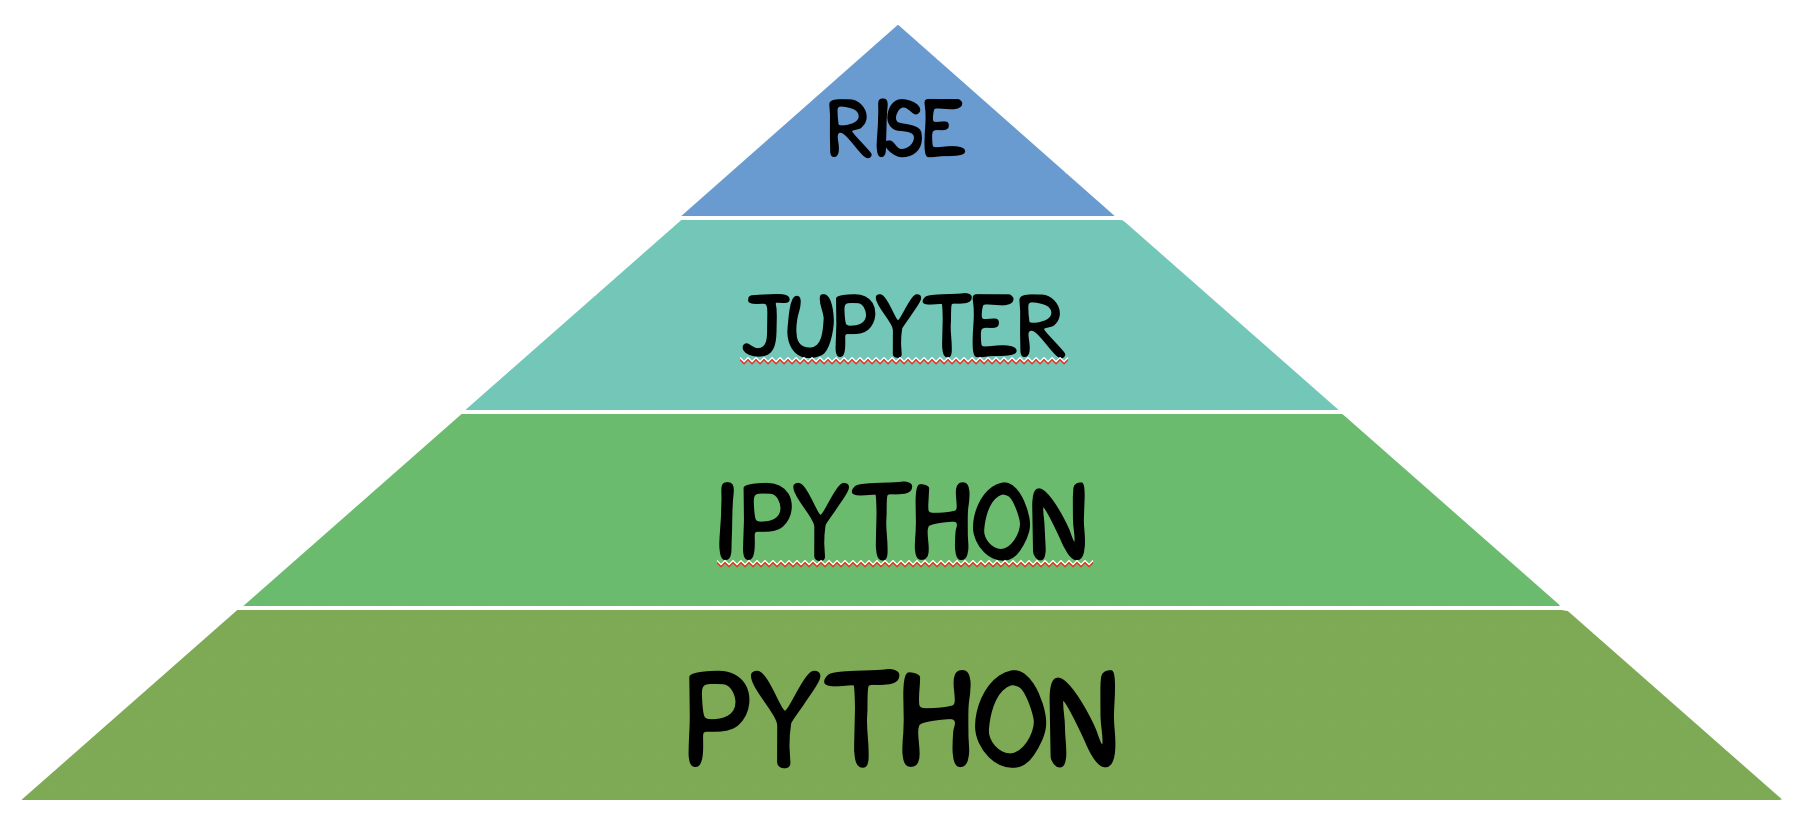
¿jupyter notebook? ¿RISE?
0.3 Sobre hacer presentaciones con jupyter y RISE
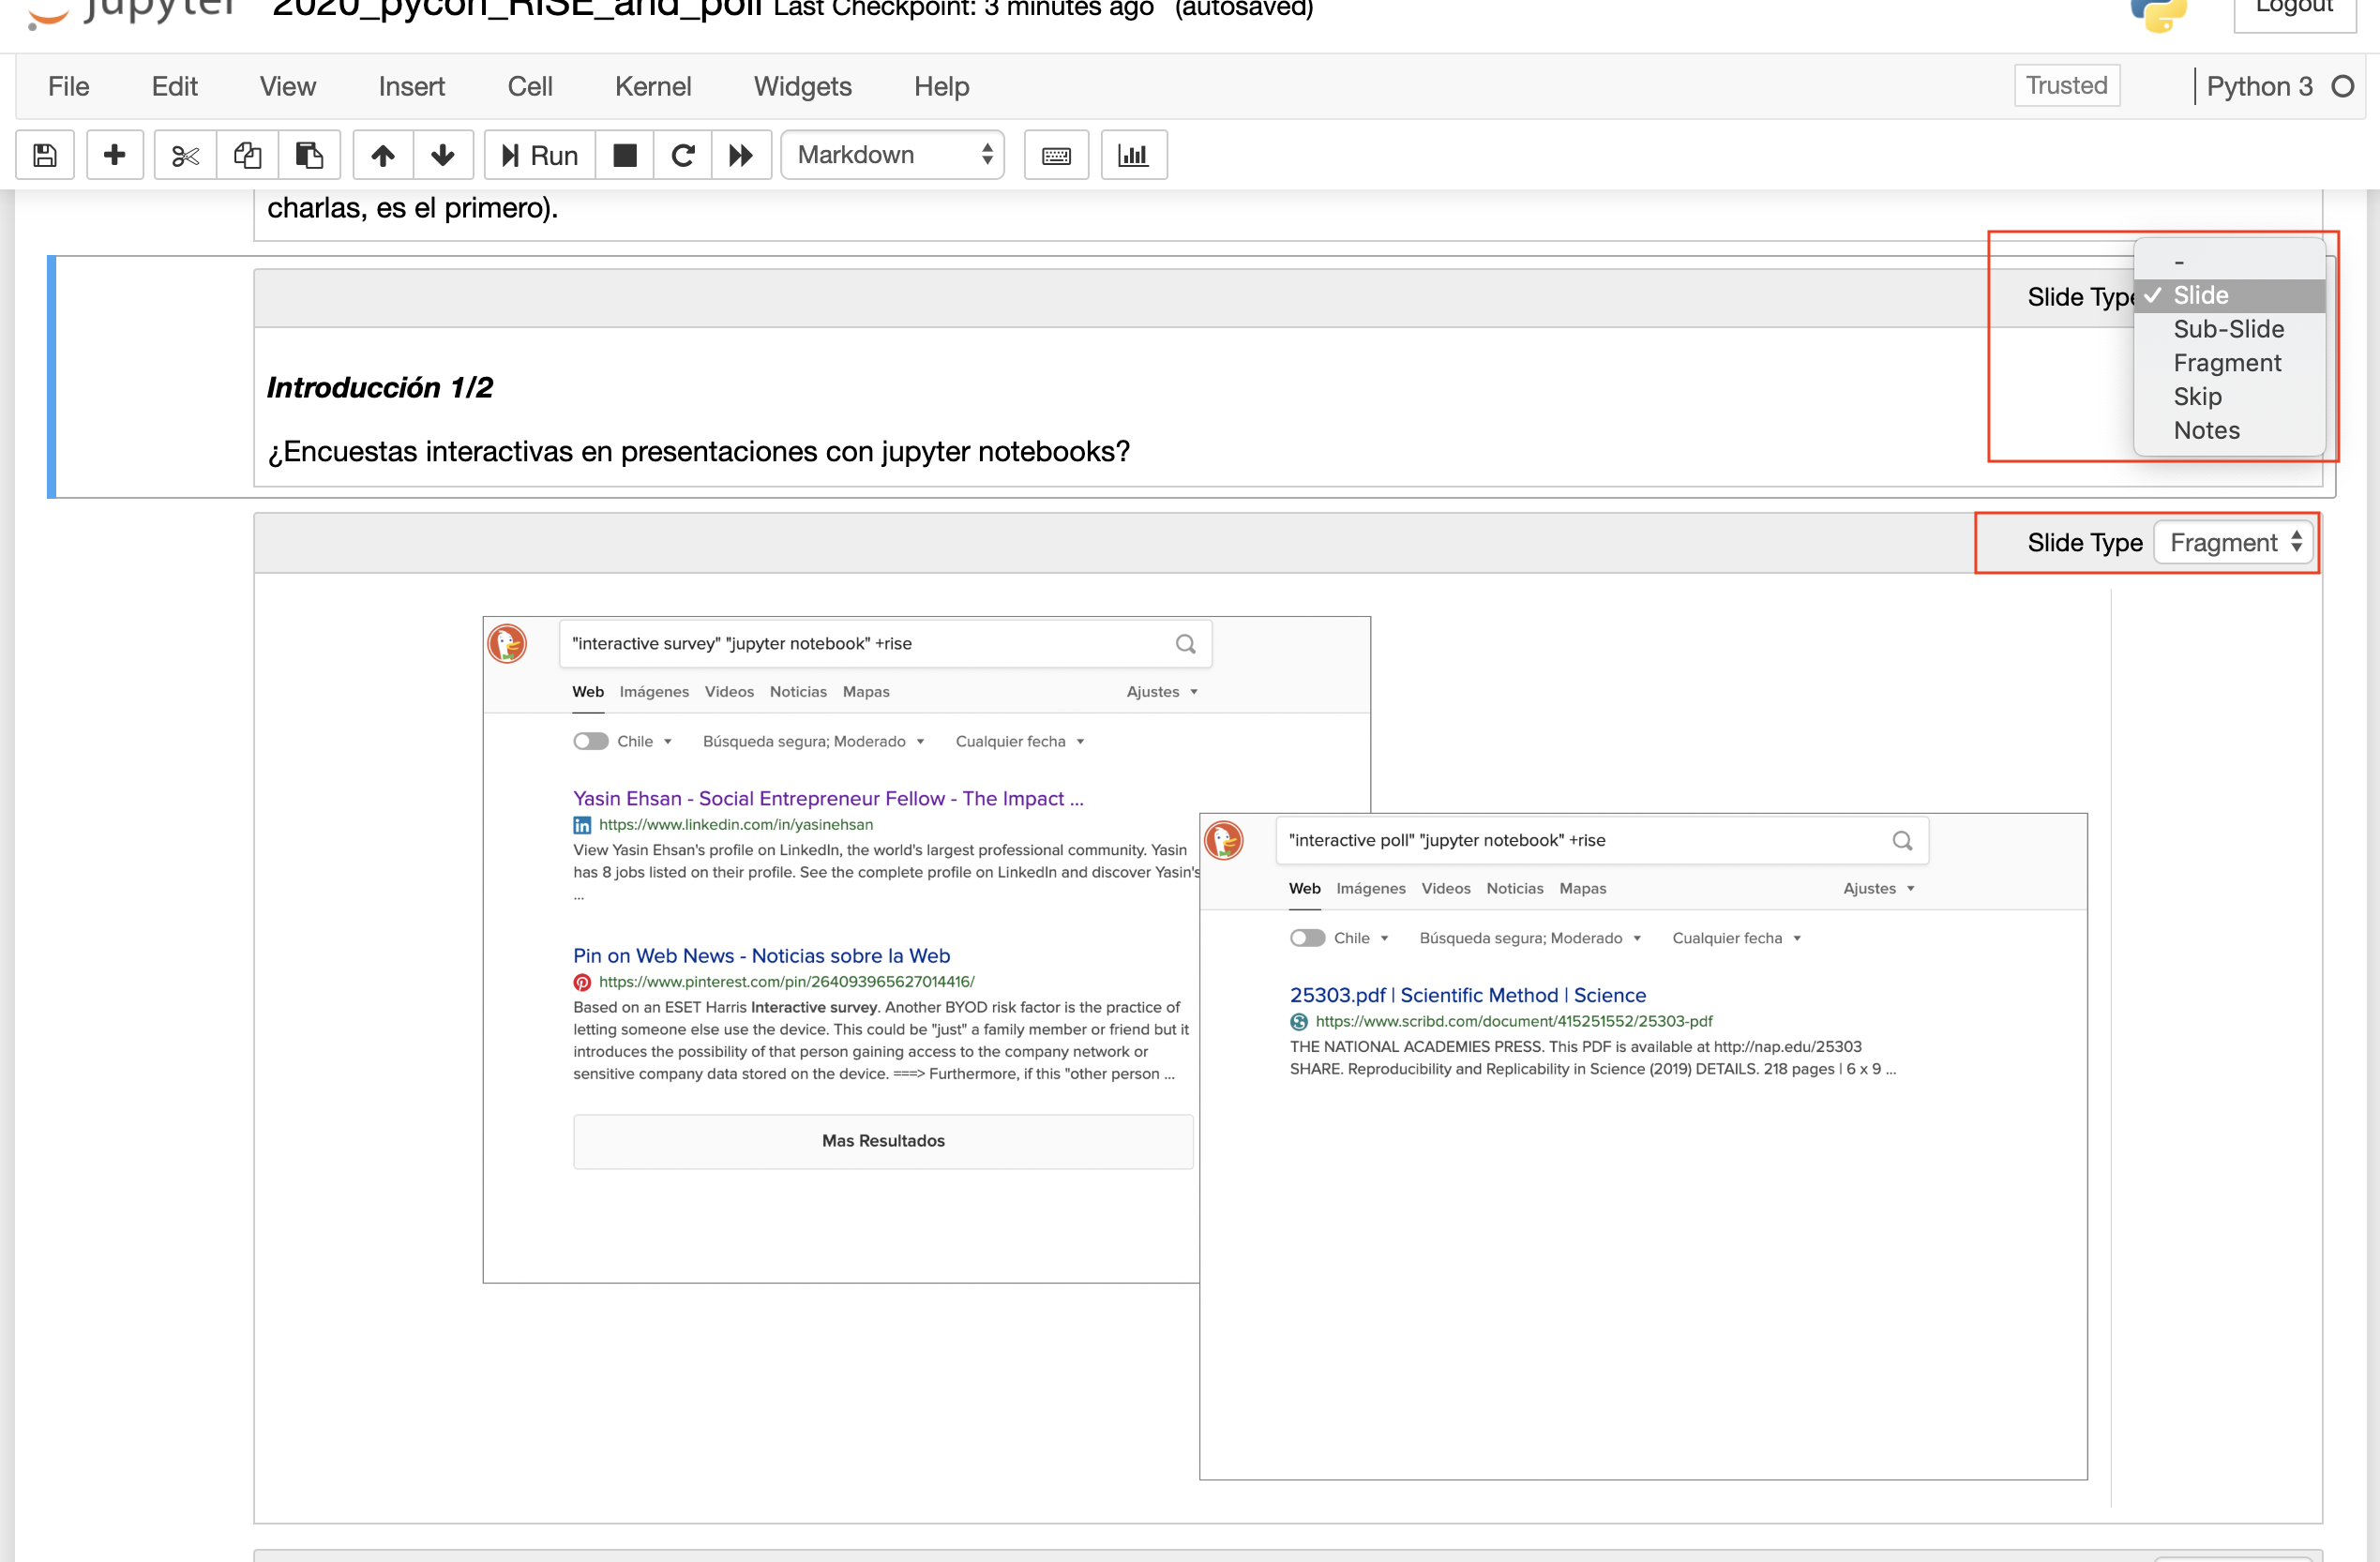
¿Qué es la extensión RISE?
Una celda de jupyter notebook se puede clasificar (adicionalmente al code/markdown) como:
- Slide: Diapositiva normal.
- Fragment: Fragmento de diapositiva.
- Sub-slide: Opcional.
- Skip: No mostrar.
- Notes: Notas.
Toda la info en https://rise.readthedocs.io/
0.3 Sobre hacer presentaciones con jupyter y RISE
¿Qué es la extensión RISE?
0.4 Sobre hacer presentaciones con jupyter y RISE
Ok, pero... ¿porqué? ¿Porqué? ¿PORQUÉ?
- Tener una presentación autocontenida: los ejemplos (código) queda en jupyter notebook.
- Corregir directamente cuando sea necesario.
- Hacer participar a la audiencia.
0.4 Sobre hacer presentaciones con jupyter y RISE
Sí, incluso ejecutar código en python
x = 200
y = 200
x is y
a = 300
b = 300
a is b
def cheeseburger(n):
    return ["bread"] + ["meat", "cheese"]*n + ["bread"]

cheeseburger(3)
0.5 Sobre hacer presentaciones con jupyter y RISE
¿Que he aprendido?
- Usa "Ctrl +" y "Ctrl -" para controlar aspecto.
- Entrega parte del control de contenido al público. Usa un teclado+mouse inalámbrico.
- Plantea desafíos de código incompleto pero entrega propuestas de solución.
gites tu amigo.
- Improvisa. Nunca será como planificaste.
0.6 Descripción del Problema
¿Qué queremos?
Realizar encuesta interactiva sin salir del modo presentación (en RISE).
¿Porqué?
Hacer encuestas para obtener retroalimentación de la audiencia cuando importa, sin cambiar pantalla o sistema.
1.7 Descripción del Problema
¿Se puede?
Sí, y de varias maneras distintas.
¿Cómo?
IFrames.
0.9 Descripción del Problema
Nuestro héroe se llama IFrame.
from IPython.display import IFrame
IFrame("https://es.wikipedia.org/wiki/Iframe", width=1000, height=500) #https://es.wikipedia.org/wiki/Iframe
0.10 Descripción del Problema
Más ejemplos ...
from IPython.display import IFrame
IFrame("https://www.python.org/", width=800, height=300)
No siempre funciona:
- https://www.python.org/
- google, facebook, twitter, ...
En general a los sitios (sobre todo los que requieren autentificación y desean hacer tracking de usuarios) bloquean los IFrames.
Podemos usar IFrame con los servicios de alguna compañía especializada en encuestas interactivas:
- Polleverywhere
- Mentimeter
- Muchos, muchos otros...
1.2 Solución nivel 1: Encuesta
Probemos este método con una encuesta simple:
from IPython.display import IFrame
IFrame("https://pollev.com/sebastianflo711", width=800, height=600)
1.3 Solución nivel 1:
Link encuesta:
¿Qué debe cumplir un sitio de encuestas interactivas?
- Encuesta acccesible por url pública, incrustable por iframe.
- Gráfico dinámico accesible por url pública, incrustable por iframe.
1.3 Solución nivel 1:
Veamos los resultados de la encuesta anterior.
from IPython.display import IFrame
IFrame("https://www.polleverywhere.com/multiple_choice_polls/7Xwy472JbCrk3fITm12XM", width=800, height=600)
# Observación: ¡requiere estar autentificado como dueño de la encuesta!
1.4 Solución nivel 1: Resumen
¿Cómo se debe usar?
- Seleccionar algún proveedor.
- Crear y configurar la encuesta previamente.
- Obtener el enlace de las preguntas, e incrustarla con un iframe.
- Obtener el gráfico de las respuestas, e incrustarla con un iframe.
- Probar que funcione correctamente. Borrar respuestas de prueba.
1.5 Pausa
¿Que viene antes, el huevo o la gallina?
# Solución al problema
# python3 permite usar unicode
sorted(['\N{EGG}', '\N{CHICKEN}'])
2.1 Problema: Realizar encuestas interactivas.
Solución Nivel 2
Una segunda opción que requiere un poco más de configuración pero entrega más control, es usar un servicio de encuestas tradicional:
- Microsoft Forms
- Google Forms
- Survey Monkey
- Typeform
- Muchas otras...
Se diferencia que nosotros podemos hacer los gráficos porque podemos descargar los datos.
2.2 Solución Nivel 2: Encuesta + Datos
Probemos este método con otra encuesta simple:
long_url = "https://forms.office.com/Pages/ResponsePage.aspx?id=zu7OdUTRPU-clJ5rQCX8_4qs5cX1Y7dFhVdiCz848sBUNFU3UzU3OTNHVDhWNURSMEs2WDBUMDdCTi4u"
short_url = "https://bit.ly/2uYDdhm"
iframe_options = {"width":800, "height":600}
IFrame(short_url, **iframe_options)
2.3 Solución Nivel 2:
Link encuesta:
¿Qué debe cumplir un sitio de encuestas nivel 2?
- Encuesta accesible al público mediante un enlace abierto. Puede que no sea incrustable con un iframe.
- Opcionalmente, que cuente con gráficos en línea.
- Datos disponibles y puedan descargarse.
- Crear una función (en Python) para descargar e interpretar los datos.
- Probar que la encuesta funcione. Borrar las respuestas de prueba.
2.4 Solución Nivel 2: Respuestas
long_url = "https://forms.office.com/Pages/AnalysisPage.aspx?id=zu7OdUTRPU-clJ5rQCX8_4qs5cX1Y7dFhVdiCz848sBUNFU3UzU3OTNHVDhWNURSMEs2WDBUMDdCTi4u&AnalyzerToken=ND54U8Erls95gHxjbyWus4LzH6FPyZ35"
short_url = "https://bit.ly/37We2dE"
iframe_options = {"width":800, "height":600}
IFrame(short_url, **iframe_options)
# Alternative to ls data/*.xlsx
import glob
glob.glob("data/*.xlsx")
import pandas as pd
df_dict = pd.read_excel("data/2020_02_08_encuesta2_pycon.xlsx", sheet_name=None)
df_dict.keys()
df = df_dict["Form1"]
question = df.columns[-1]
print(question)
df.head()
2.5 Solución Nivel 2: Respuestas
question_df = df[question]
answer_counts = question_df.value_counts()
answer_counts
from matplotlib import pyplot as plt
answer_counts.plot.barh(figsize=(16,6))
plt.show()

2.6 Solución Nivel 2: Respuestas
Hagamos un gráfico un poco mejor.
from matplotlib import pyplot as plt
answer_counts.plot.barh(figsize=(16,6), fontsize=16, alpha=0.60)
plt.suptitle(question, fontsize=16)
plt.xlabel("Número de respuestas", fontsize=16)
plt.ylabel("");

2.7 Solución nivel 2: Resumen
- Elegir algún proveedor.
- Crear la encuesta.
- Obtener la url pública de las preguntas, e incrustarla en un iframe.
- Obtener la url de los datos de las respuestas.
- Usar una api o descargar los datos.
- Graficar desde python para interpretar los datos.
2.1 Problema: Realizar encuestas interactivas.
Solución Nivel 3
La solución más compleja es por supuesto hacer el sistema completo:
- Base de datos: donde almacenar la encuesta y las respuestas.
- Frontend: para realizar la encuesta (mostrar preguntas, recolectar respuestas, mostrar gráficos).
- Backend: interactuar con la base de datos.
En este caso: mysql, flask, flask-mysql y pandas, con algo de html y css, y una librería de javascript para graficar.
Solución Nivel 3
¿Porqué alguien voluntariamente se sometería a este tormento?
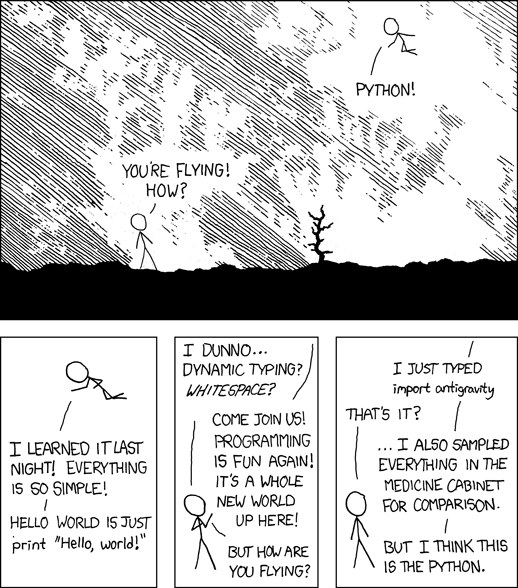
Filosofía xkcd:
¿Porqué hacer algo simple cuando podrías hacer algo extremadamente complejo de la manera más simple posible, aprendiendo mucho en el camino?

Solución Nivel 3
¿xkcd en python?
import antigravity
Solución Nivel 3
from IPython.display import IFrame
IFrame("http://localhost:5000/", width=1200, height=800)
Solución Nivel 3
El código de polite se encuentra en https://github.com/sebastiandres/surveys_with_flask_and_xkcd_charts.
Hace uso de muchos recursos públicamente disponibles (además de mysql y python+librerías):
- Font xkcd.ttf de ipython, https://github.com/ipython/xkcd-font
- Librería xkcd_chart en javascript: https://timqian.com/chart.xkcd/
- Una cantidad vergonzosamente grande de búsquedas en internet y stackoverflow.
Solución Nivel 3
Una de las cosas que más me llamó la atención fue cómo hacer una función que pudiese transformar un texto markdown en la serie de preguntas y opciones de respuesta.
Requería definir convenciones:
- La pregunta es todo lo que va antes de
: - Las preguntas de respuesta única se definen por
* - Las preguntas de respuesta única se definen por
^
Otra opción podría haber sido - y +.
Es una mala opción usar o y m.
Solución Nivel 3
def markdown_parser(my_text):
    if my_text.count(":")!=1:
        print("Cannot parse, there's an error in the format")
        return {"is_format_ok":False, "markdown_str":my_text}
    single_option = 0
    multiple_option = 0
    if ("* " in my_text):
        single_option = 1
        split_char = "*"
    if ("^ " in my_text):
        multiple_option = 1
        split_char = "^"
    # If both False or both True, simultaneoulsy, there's an error
    if single_option==multiple_option:
        print("Cannot parse, there's an error in the format")
        return {"is_format_ok":False, "markdown_str":my_text}
    question_str, answer_str = my_text.split(":")
    question = question_str.strip()
    answer_list = [_.strip() for _ in answer_str.split(split_char)[1:6]] # Skip the empty string, reach to the fifth existing one
    answer_list = answer_list + ["" for _ in range(5-len(answer_list))] # Fill with empty ones if needed
    question_type = single_option*"radio"+multiple_option*"checkbox" # This is the html convention
    # Create the dict
    md_dict = {}
    md_dict["is_format_ok"] = True
    md_dict["markdown_str"] = my_text
    md_dict["type_str"] = question_type
     md_dict["question_str"] = question
    md_dict["option_1_str"] = answer_list[0]
    md_dict["option_2_str"] = answer_list[1]
    md_dict["option_3_str"] = answer_list[2]
    md_dict["option_4_str"] = answer_list[3]
    md_dict["option_5_str"] = answer_list[4]
    return md_dict
Solución Nivel 3
markdown_parser("Q: ^ A * B * C * D * E * F * G ")
markdown_parser("""Q: ^ A ^ B ^ C ^ D ^ E ^ F ^ G ^ H""")
Conclusión: Encuestas nivel 1
| Ventaja | Desventaja | |
| Complejidad | Trivial | - |
| Precio | Versión limitada gratis | Versión pagada con más funcionalidades |
| Gráficos | Gráficos predefinidos | Gráficos predefinidos |
| Datos | - | Sin accceso a datos |
Conclusión: Encuestas nivel 2
| Ventaja | Desventaja | |
| Complejidad | Simple | |
| Precio | Versión gratis es suficiente | |
| Gráficos | Configurables | Requieren código |
| Datos | Con accceso a datos |
Conclusión: Encuestas nivel 3
| Ventaja | Desventaja | |
| Complejidad | Bastante complejo. Toma tiempo. Deployment puede ser complejo. | |
| Precio | Hosting gratis es suficiente | Time=Money? |
| Gráficos | Configurables | Hay que configurarlos completamente. |
| Datos | Con accceso completo a datos | Hay que almacenar los datos. |
Encuesta sobre la charla: